
Tables and Figures
When including a figure or a table from another source in your work, it is important to include appropriate citations. Any image used in your assignment requires a caption. If the image is not your own work it also requires an in-text citation to the original source.
Any illustration or image in APA is treated as either a Table or a Figure. The purpose of tables and figures in documents is to enhance your readers’ understanding of the information in the document. Tables are numerical values or text displayed in rows and columns. Figures are other illustrations such as graphs, charts, maps, drawings, photographs etc.
All Tables and Figures must be referred to in the main body of the text and in the reference list. Because tables and figures supplement the text, refer in the text to all tables and figures used and explain what the reader should look for when using the table or figure. All tables and figures in your document should use a similar format, with the results organized in a comparable fashion. Use the same name and scale in all tables, figures, and the text that use the same variable. Each table and figure must be discussed in the text. An informative table will supplement but will not duplicate the text. In the text, discuss only the most important parts of the table. Make sure the table can be understood by itself without the accompanying text; however, it is never independent of the text. There must be a reference in the text to the table.
Number all Tables and Figures sequentially as they first appear in the text.
Refer to them in the text by their number. For example:
As shown in Table 2 …
OR
As illustrated in Figure 3…
Any image that is reproduced from another source also needs to come with copyright permission; it is not enough just to cite the source.
Tables
Tables are characterized by a row-column structure.
Data in a table that would require only two or fewer columns and rows should be presented in the text. More complex data is better presented in tabular format.
- APA's default typeface and size are 12-point Times New Roman (sixth ed., p. 228).
- Also, double-space all text, including the captions (sixth ed., p. 241).
- Notice that there are no vertical lines in an APA style table.
Arabic numerals are used to number tables in the order in which they appear in the text. Do NOT write in the text “the table on page 17” or “the table above or below.” The correct method would be to refer to the table number like this: (see Table 1) or “Table 1 shows…” Left-justify the table number (see Table 1).
Each table should be displayed with a clear and concise title. The table title and headings should concisely describe what is contained in the table. Abbreviations that appear in the body of the table can sometimes be explained in the title; however, it may be more appropriate to use a general note.
Each word in the title should be italicized and capitalized except with, of, in, and, etc. The Title is in italics but the Table Number is not. Also note the space between the title and the top of the table.
|
Example of Title |
Table 1 |
There must be a caption beneath the table. Use the following format - this format differs from the reference list format.
if you are adapting material from multiple sources - that is, extracting rows or columns from previously published tables and integrating them into a single table - you might need to include multiple permission statements, one for each source.
If you are simply pulling data from multiple sources, rather than repurposing columns or rows from preexisting tables (the data are not subject to copyright, but their presentation is), then it may be appropriate to just include standard author–date text citations within the table. This type of table is often used to summarize the results of multiple studies, which makes it easier for readers to digest the information, and is commonly used in meta-analyses.
Table 1
Summary of Studies Included in Meta-Analysis on the Effectiveness of Rocking Out Like No One’s Watching (ROLNOW)
|
Study
|
N
|
Cohen’s d
|
SD
|
|
Atashin (2013) |
384 |
0.86 |
0.63 |
|
Dumile & Jackson (2015) |
176 |
1.21 |
0.95 |
|
Garcia, Homme, Oliveri, & Bjork (2014) |
231 |
0.72 |
0.64 |
|
Iyer, Lehman, & Sorey (2014) |
406 |
1.14 |
0.97 |
|
Onuki, Agata, & Hamamoto (2014) |
127 |
0.63 |
0.41 |
Table 2
Sample Responses to the ROLNOW Survey
|
Variable
|
Question
|
Sample responses
|
|
Coolness |
How cool did you feel? |
Cool as a cucumber in a bowl of hot sauce.”a |
|
Motivation/energy |
How motivated and energized did you feel? |
I felt ready to take on the world!”c |
|
Happiness |
How happy were you? |
I was completely elated and filled with positive thoughts!”d |
|
Attractiveness |
How physically attractive did you feel? |
I felt pretty, oh so pretty!”e |
aDumile and Jackson (2015, p. 31). bIyer, Lehman, and Sorey (2014, p. 79). cOnuki, Agata, and Hamamoto (2014, p. 101). dGarcia, Homme, Oliveri, and Bjork (2014, p. 47). eAtashin (2013, p. 56).
Notes are often used with tables. There are three different forms of notes used with tables:
(a) to eliminate repetition in the body of the table,
(b) to elaborate on the information contained in a particular cell, or
(c) to indicate statistical significance:
A general note provides information relating to the table as a whole, including explanations of abbreviations used, symbols, and the like. Included within general notes would be any acknowledgments that a table is reproduced from another source. General notes are designated by the word Note (italicized) followed by a period.
Note. Factor loadings greater than .45 are shown in boldface. M = match process; N = nonmatch process.
A specific note makes a reference to a specific row, column, or cell of the table and is given a superscript lowercase letter (e.g., a, b, c), beginning with the letter “a”: a n = 50.
Within the headings and table body, order the superscripts from left to right and from top to bottom, starting at the top left.
A probability note is to be included when one or more inferential statistics have been computed and there isn’t a column showing the probability, p. Asterisk(s) indicate the statistical significance of findings presented within the table. Try to be consistent across all tables in a paper. The important thing is to use the fewest asterisks for the largest p value. It is common to use one asterisk for .05 and two for .01. For example:
*p < .05. **p < .01.
Notes should be listed with general notes first, then specific notes, and concluded with probability notes, without indentation. They may be single spaced for better presentation. Explain all uses of dashes and parentheses. Abbreviations for technical terms, group names, and those of a similar nature must be explained in a note to the table.
E.g.
Note. General notes to a table appear here, including definitions of abbreviations.
a A specific note appears on a separate line below any general notes; subsequent specific notes are run in.
*A probability note (p value) appears on a separate line below any specific notes; subsequent probability notes are run in.
|
Format of Caption |
Note. Reprinted from “Title of Article,” by A. B. Author and C. D. Author, Year, Journal Title, Volume(issue), page number. Copyright (year) by title of publisher. OR Note. Reprinted from Title of Book (p. xx), by E. F. Author, Year, Place of Publication: Publisher. Copyright (year) by title of publisher. Note. Data for hot sauce consumption in the United States from Kantar Media (2010), for Canada from Statistics Canada (2011), and for Britain from Euromonitor International (2010b).
Note. Population figures for XYZ from Author (date) and for ABC from Author (date). Data for pet ownership for XYZ from Author (date) and for ABC from Author (date).
Note. Factor loadings > .40 are in boldface. SPQ = Schizotypal Personality Questionnaire; DAPP = Dimensional Assessment of Personality Pathology - Basic Questionnaire.
Note. Factor loadings > .40 are in boldface. SPQ = Schizotypal Personality Questionnaire; DAPP = Dimensional Assessment of Personality Pathology - Basic Questionnaire. Adapted from “A Dimensional Model of Personality Disorder: Incorporating DSM Cluster a Characteristics,” by J. L. Tackett, A. L. Silberschmidt, R. F. Krueger, and S. R. Sponheim, 2008, Journal of Abnormal Psychology, 117, p. 457. Copyright 2008 by the American Psychological Association.
Note. A, B, C, and D were four conditioned stimuli: a clicker, tone, light, and flashing light, respectively (counterbalanced). + denotes a 0.4-mA shock unconditioned stimulus; ++ denotes two 0.4-mA shocks; + denotes a 0.8-mA unconditioned stimulus. Adapted from “Unblocking in Pavlovian Fear Conditioning,” by L. Bradfield and G. P. McNally, 2008, Journal of Experimental Psychology: Animal Behavior Processes, 34, p. 259. Copyright 2008 by the American Psychological Association. |
Figures reproduced in your text
As tables supplement the text, so should each figure. Figures include: maps, graphs, charts, drawings, and photographs, or any other illustration or non-textual depiction in printed or electronic resources.
The APA has determined specifications for the size of figures and the fonts used in them. Figures of one column must be between 2 and 3.25 inches wide (5 to 8.45 cm). Two-column figures must be between 4.25 and 6.875 inches wide (10.6 to 17.5 cm). The height of figures should not exceed the top and bottom margins. The text in a figure should be in a san serif font (such as Helvetica, Arial, or Futura). The font size must be between eight and fourteen point. Use circles and squares to distinguish curves on a line graph (at the same font size as the other labels).
When you use a figure in your paper that has been adapted or copied directly from another source, you need to reference the original source. This reference appears as a caption underneath the figure that you copied or adapted for your paper.
Any image that is reproduced from another source also needs to come with copyright permission; it is not enough just to cite the source.
- Number figures consecutively throughout your paper.
- Double-space the caption that appears under a figure.
Each figure should be displayed with an explanatory title.
|
Example of Title |
Figure 1. ABC Company Organisational Chart. |
You must include a caption beneath the figure. For figures, make sure to include the figure number and a title with a legend and caption. These elements appear below the visual display. For the figure number, type Figure X. Then type the title of the figure in sentence case.
Use the following format - this format differs from the reference list format.
|
Format of Caption |
Figure X. Descriptive title for figure. Reprinted from “Title of Article,” by A. Author, B. Author, and C. D. Author, Year, Journal Title, Volume(issue), page number. Copyright (year) by title of publisher. OR Figure X. Descriptive title for figure. Reprinted from Title of Book (p. xx), by E. F. Author, Year, Place of Publication: Publisher. Copyright (year) by title of publisher. |
If a table or figure was being reproduced for a published work, permission would need to be sought from the copyright holder and this information included in the caption. For example: Copyright 2014 by the ABC Company. Reprinted with permission.
Example of Formatting for Tables
|
From a journal article |
|
|
In-text citation format |
Table X would indicate that...... |
|
Title above table |
Table X (add title or description of table) |
|
Caption below table |
Note. Adapted/Retrieved/Reprinted from "Title of Article," by A. A. Author, B. B. Author, and C. C. Author, year, Title of Journal, volume(issue), page(s). Copyright (year) by (publisher). Note. Reprinted from "Education in modern life," by A. A. Aroud, B. B. Jons, & C. C. Gland, 2015, Journal of Language and Education, 1(3), 17. Copyright by 2015 National Research University "Higher school of Economics". |
|
Refence list format |
Author, A. A., Author, B. B., & Author, C. C. (year). Title of article. Title of Journal, volume(issue), page(s). Retrieved from URL The Nielsen Company. (2011). Sales of vitamins/minerals & herbal supplements in New Zealand, 11 September 2010 - 11 September 2011 [Table]. Retrieved from ACNielsen Market Information Digest New Zealand. |
Example of table layout
Table 1
IRS and DRS Totals for Say, Said, Tell and Told
| IRS | IRS | IRS | IRS | DRS | DRS | DRS | DRS | |
| TotSAID | TotSAY | TotTOLD | TotTELL | TotSAID | TotSAY | TotTOLD | TotTELL | |
| Frazier | 241 | 152 | 189 | 192 | 83 | 65 | 10 | 8 |
| Friends | 253 | 90 | 153 | 237 | 101 | 89 | 8 | 8 |
| Jazz | 85 | 72 | 30 | 42 | 514 | 95 | 14 | 10 |
Note. Adapted from "Journal of Language and Education, Russia, 1(1), 17-25. Copyright 2015 by the National Research University Higher School of Economics.
Example of figure layout
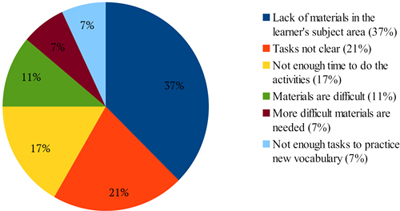
Figure 5. Concerns expressed by learners (72 responses).
Example of reference
|
Reference list format |
Author, A. A. (year of publication). Title of publication (Number of report). Retrieved from URL |
|
Reference list entry |
Australian Bureau of Statistics. (2015). Migration, Australia, 2013-14 (No.3412.0). Retrieved from http://www.abs.gov.au |
Examples of Formatting for Figures
Figures from websites:
|
Format of In-text Citation |
Figure X. (Figure number is assigned by the author) |
|
Title above figure |
Figure X. Title or description of figure/image/photograph etc. |
|
Caption below figure |
Figure X. Title of Image. Reprinted [or adapted] from Title of Website, by A. A. Author and B. B. Author, Year, Retrieved from URL. Copyright (year) by title of publisher. Figure 1. An example of the cobra yoga position. Reprinted from List of Yoga Postures, In Wikipedia, n.d., Retrieved October 28, 2009, from http://en.wikipedia.org/wiki/List_of_yoga_postures. Copyright 2007 by Joseph Renger. Reprinted with permission. Figure 1. From “Nutrition, Physical Activity and Obesity: Data, Trends and Maps. Alabama Indicator Details Percent of Adults Aged 18 Years and Older Who Are Obese,” by Centers for Disease Control and Prevention, 2015, Retrieved from http://nccd.cdc.gov/NPAO_DTM/DetailedData.aspx?indicator=29&statecode=30. In the public domain. |
|
Reference list Format |
Author, A. A., & Author, B. B. (year of publication). Title of figure [format]. Retrieved from URL Centers for Disease Control and Prevention. (2015). Nutrition, physical activity and obesity: Data, trends and maps. Alabama indicator details percent of adults aged 18 years and older who are obese. Retrieved from http://nccd.cdc.gov/NPAO_DTM/DetailedData.aspx?indicator=29&statecode=30 |
Figures from journal articles:
|
Format of In-text Citation |
Figure X demonstrates that..... |
|
Title above figure |
Figure X. Title or description of figure/image/photograph etc. |
|
Caption below figure |
Figure X. Title of image. Reprinted/Adapted from "Title of Article," by A. A. Author and B. B. Author, year, Journal Title, volume(issue), page number(s). Copyright (year) by title of publisher. Figure 1. Schematic drawings of a bird's eye view of the table (a) and the test phase of the choice task (b). Numbers represent the dimensions in centimeters. Adapted from "Visual Experience Enhances Infants' Use of Task-Relevant Information in an Action Task," by S.-h. Wang and L. Kohne, 2007, Developmental Psychology, 43, p. 1515. Copyright 2003 by the American Psychological Association. |
|
Reference list Format |
Author, A. A., & Author, B. B. (year of publication). Title of article. Journal Title, volume number(issue number), page–page. Retrieved from URL McFarland, L. A., & Ployhart, R. E. (2015). Social media: A contextual framework to guide research and practice. Journal of Applied Psychology, 100, 1653–1677. http://dx.doi.org/10.1037/a0039244 |
Figures created by the author:
|
Caption below figure |
Figure 1. Mean difference values (ms) representing detection speed for each target category subtracted from the mean detection speed for neutral targets. No age differences were found in the arousal-mediated effects on detection speed. Standard errors are represented in the figure by the error bars attached to each column. Figure 1. How to create figures in APA style. This figure illustrates effective elements in APA style figures. |
Comments:
- All tables and figures must be mentioned in text.
- All the sources must have a full bibliographic entry in your Reference List even though the information in the Notefield uses a lot of the same information.
- Before you reproduce any image in your paper it may be necessary to get copyright permission to do so from the original copyright holder and place the wording “Reprinted with permission”at the end of your citation.
- Use the term “Adapted” instead of “Reprinted” if you have altered the table or the figure.
More information on Figures & Tables
Sections 5.01-5.30 in the Publication manual of the American Psychological Association, 6th edition (pp 125–167)
The APA Style blog - Tables & Figures
Information on citing and several of the examples in this guide were drawn from the APA Manual (6th ed.) and the APA Blog Navigating Copyright for Reproduced Images: http://blog.apastyle.org/apastyle/2016/01/navigating-copyright-part-1.html.

